Analyzing the Forex Market
Fundamental analysis, Technical analysis, Market sentiment – considered by traders when analyzing the Forex market.
There are different approaches to the Forex market. These are the ways by which traders form their opinions about the market and make their trading decisions. All these approaches can be summed up into the three:
-
Fundamental analysis
-
Technical analysis
-
Market sentiment
Here is a discourse of these three primary approaches to the Forex market and how you can incorporate them into your trading arsenal.
Fundamental Analysis
Fundamental analysis is the use of “fundamental” economic indicators to approach the Forex market. Fundamental analysts evaluate economic reports and news and the monetary policies of different nations to make their trading decisions.
This category of traders attempts to do to currencies what fundamental stock traders do to stocks by attempting to determine the direction of the economy of a nation and the intrinsic value of its currency. This they do by examining different economic indicators such as:
-
Inflation
-
Interest rate
-
Retail sales
-
Balance of trade
-
Gross Domestic Product (GDP)
For instance, a high inflation rate can have a negative effect on the value of a currency relative to the currency of another country. On the other hand, a high interest rate usually makes a currency desirable relative to other currencies of countries with lower interest rates.
Technical Analysis
Market technicians pay attention to one thing: price. Their working principle is that the price is the most important factor to watch. Hence, it is all there is. As a result, they pay attention to it the most. And they analyze the price using a range of tools.
The two most popular of these tools are:
-
Charts
-
Indicators
Charts used in Forex trading are of three types and they are line, bar, and candlesticks. However, the Japanese candlestick chart type is the most widely used as it presents market information in a graphic and intelligible way.
Also, Forex traders use different Japanese candlestick patterns to make trading decisions. For example, there are bullish and bearish candlesticks which communicate specific messages to the savvy trader.
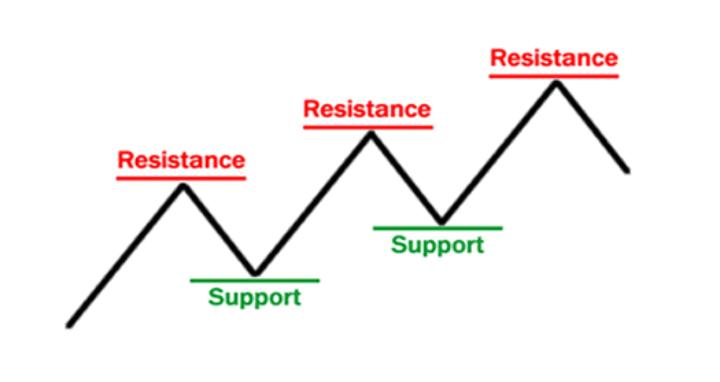
In analyzing price action, support and resistance levels are another set of important details that technical Forex traders observe on the charts. They represent strategic points at which the market tends to reverse.
A support level, for example, indicates that the preexisting downtrend is already waning and that there will be a reversal soon. Likewise, at a zone of resistance, traders expect the preexisting uptrend to weaken and the market to reverse. Then, they look for reversal candlestick patterns to confirm the reversal in trend before they take their trades.

©BabyPips.com
Most Forex market technicians also use one form of technical indicator or another. Technical indicators are based on price and are used to predict the market trend. Examples are the Stochastic, moving averages, and the Relative Strength Index (RSI).
Market Sentiment
Market sentiment is the collective opinion of participants about the market at any time. Is the market bullish or bearish? That is, are there more buyers than sellers? What is the trend?
Finally, you can combine market sentiment with other approaches earlier discussed to develop a unique method of approaching the Forex market.
You can learn how to by taking courses provided by ForexCT, the leading Australian Forex and CFD broker.


